The UK Housing Market Report for August 2023 offers a comprehensive snapshot of the United Kingdom’s property market during this pivotal month. This report provides essential insights into key statistics, economic trends, and price fluctuations, offering a clear picture of the state of the housing market. From annual and monthly price changes to regional variations and market dynamics, this report is a valuable resource for individuals and professionals seeking to understand the latest developments in the UK’s real estate sector.
1. Key Findings for August 2023
- The average property price in the UK for August 2023 was £291,000.
- The yearly price change for UK properties stood at 0.2%.
- Monthly property prices showed a 0.3% increase.
- The monthly index figure, with January 2015 as the base (100), reached 152.6.
Please note that estimates for recent months are provisional and subject to updates as additional data is integrated into the index. Refer to the Revisions to the UK HPI data for further information.
2. Economic Overview
The annual percentage change for average UK house prices was provisionally estimated at 0.2% for the 12 months ending in August 2023, compared with the revised estimate of 0.7% for the 12 months ending in July 2023.
The average UK house price for August 2023 (provisional estimate) remained largely unchanged from the previous year but increased by £9,000 compared to the recent low point in March 2023.
Average house prices during the 12 months ending in August 2023 remained stable in England at £310,000 (0.0%), decreased in Wales to £217,000 (-0.1%), and increased in Scotland to £194,000 (1.1%). In the year leading to Q2 (April to June) 2023, the average house price in Northern Ireland rose to £174,000 (2.7%).
On a non-seasonally adjusted basis, average UK house prices increased by 0.3% between July 2023 and August 2023, in contrast to the 0.8% increase observed during the same period one year ago.

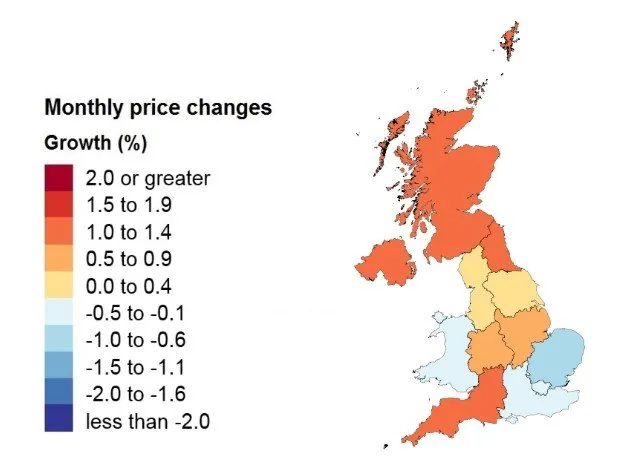
The Northeast exhibited the highest annual house price inflation at 3.6% for the 12 months ending in August 2023, while the East of England recorded the lowest annual inflation in England, with prices decreasing by 1.6% in the 12 months to August 2023.
Reports from the Royal Institution of Chartered Surveyors (RICS) indicated a significant decline in buyer demand, while the Bank of England’s Agents reported a balance between supply and demand, resulting in price stability.
HMRC’s UK Property Transactions Statistics for August 2023 showed a 15.6% decrease in transactions compared to the previous year. However, UK transactions increased by 1.1% between July 2023 and August 2023 on a seasonally adjusted basis.
The Bank of England’s Money and Credit release for August 2023 reported a decrease in mortgage approvals for house purchases, reaching the lowest level in six months.
You Can Read Through Our Report for The UK Housing Market Report Released for July 2023 and Compare the Data and Analyse the Changes Yourselves!!! Read it Now!
3. Property Price Changes
Average house prices in the UK registered a 0.2% increase for the 12 months ending in August 2023, down from 0.7% in July 2023.
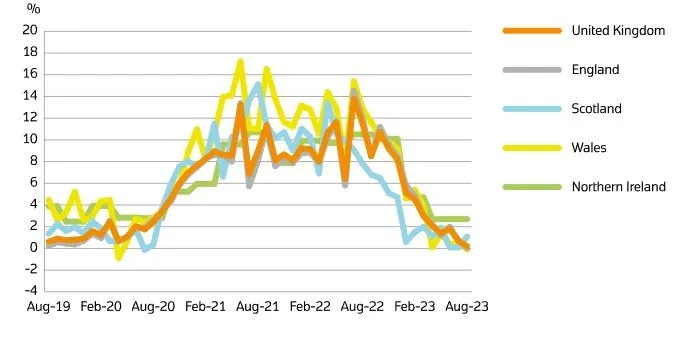
Scotland witnessed the highest annual house price percentage change, with a 1.1% increase in the 12 months leading to August 2023.
England’s average house prices remained almost unchanged (0.0%) for the 12 months ending in August 2023.
Wales saw average house prices decrease by 0.1% for the 12 months ending in August 2023, marking the first negative annual inflation since April 2020 when it was -0.9%.
Northern Ireland’s average house prices increased by 2.7% over the 12 months ending in Quarter 2 (April to June) 2023.
| Country and government office region | Price | Monthly Change | Annual Change |
| England | £310,000 | 0.2% | 0.0% |
| Northern Ireland (Quarter 2 – 2023) | £174,000 | 1.4% | 2.7% |
| Scotland | £194,000 | 1.2% | 1.1% |
| Wales | £217,000 | -0.1% | -0.1% |
| East Midlands | £251,000 | 0.6% | 0.5% |
| East of England | £351,000 | -0.7% | -1.6% |
| London | £536,000 | -0.1% | -1.4% |
| North East | £165,000 | 1.3% | 3.6% |
| North West | £216,000 | 0.0% | 0.4% |
| South East | £393,000 | -0.1% | -0.6% |
| South West | £328,000 | 1.2% | -1.1% |
| West Midlands Region | £254,000 | 0.5% | 1.1% |
| Yorkshire and The Humber | £213,000 | 0.4% | 2.2% |
On a non-seasonally adjusted basis, average house prices in the UK increased by 0.3% between July 2023 and August 2023, down from the 0.8% increase during the same period one year ago (July 2022 and August 2022). Seasonally adjusted, average house prices in the UK increased by 0.2% between July 2023 and August 2023.
4. Sales Volumes
The time lag between property sale and registration varies, typically ranging from 2 weeks to 2 months or longer. Volume figures for the most recent 2 months are not yet at a reliable level for reporting and are excluded from this report.
Transactions involving new registers, such as new builds, are more complex and require additional processing time.
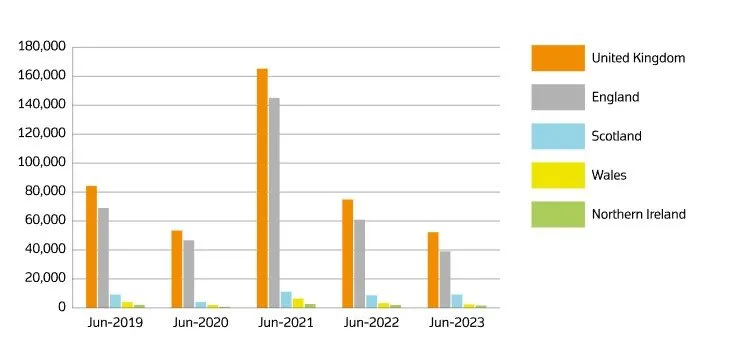
A comparison of provisional UK HPI volume estimates for June 2022 with June 2023 showed a 5.6% decrease in volume transactions in England, an 8.7% increase in Scotland, and an 8.7% increase in Wales. Northern Ireland’s UK HPI volume transactions decreased by 17.6% in the year ending in Quarter 2 2023.
UK Property Transaction Statistics published by HM Revenue & Customs reported a 10.7% decrease in HMRC volume transactions in England for the 12 months ending in June 2023. In the same period, transactions increased by 8.8% in Scotland, decreased by 3.7% in Wales, and decreased by 9.3% in Northern Ireland on a non-seasonally adjusted basis.
Comparing the provisional UK HPI volume estimate for June 2022 with June 2023, UK volume transactions decreased by 3.2%.
UK Property Transaction Statistics published by HM Revenue & Customs reported an 8.8% decrease in HMRC volume transactions for the UK for the 12 months ending in June 2023 on a non-seasonally adjusted basis.
5. Property Registration Status in the UK
Transactions involving the creation of a new register, such as new builds, require more processing time and are not included in the report due to unreliable volume data for the most recent 2 months.
| Property Status | Average price August 2023 | Monthly Change | Annual Change |
| New Building | £414,000 | 3.9% | 20.6% |
| Existing resold property | £280,000 | 1.0% | 0.8% |
6. Buyer Status in Great Britain
For Great Britain, data on buyer status in Northern Ireland is not available.
| Type of Buyer | Average price August 2023 | Monthly Change | Annual Change |
| First Time Buyer | £242,000 | 0.4% | 0.1% |
| Former Owner Occupier | £341,000 | 0.3% | 0.3% |
7. Funding Status in Great Britain
For Great Britain, data on funding status in Northern Ireland is not available.
| Funding Status | Average price August 2023 | Monthly Change | Annual Change |
| Cash | £275,000 | 0.3% | -0.2% |
| Mortgage | £304,000 | 0.3% | 0.4% |
Conclusion
In summary, the UK housing market in August 2023 displayed a modest annual price change of 0.2%, reflecting a shift from the previous month’s figures. While buyer demand continued to decline, supply and demand appeared to be approaching a balance, resulting in more stable prices. Transaction volumes fluctuated, with marked differences across regions. As the market adapts to these shifts, it remains essential for stakeholders to monitor these trends closely. Stay tuned for further updates and analyses to gain a deeper understanding of the ever-evolving UK housing market.